
Event graphs
Every swim of one event on a graph.
Tap any event (on the swimmer page, in Progress or in County times) to see every swim of it on a graph.
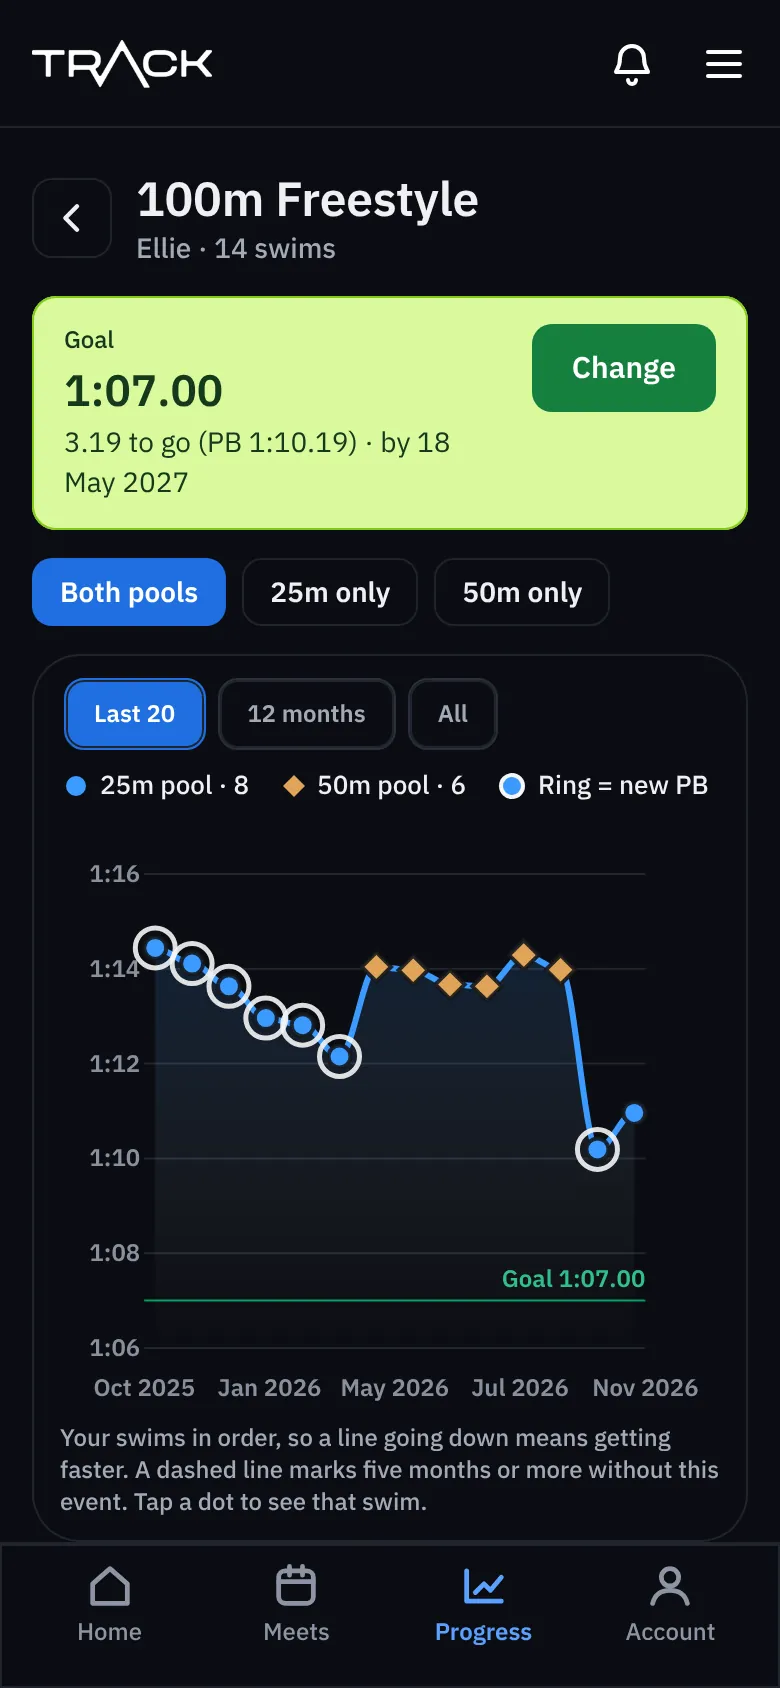
- A line going down means getting faster. A ring marks a new PB.
- Choose Both pools, 25m only or 50m only, and how far back: the last 20 swims, 12 months, or all.
- A dashed line marks a gap of five months or more without that event.
- Tap a dot to see that swim.
- If there's a goal, it's drawn as a line across the graph.
Under the graph
How close the event is to the county time, then some simple numbers:
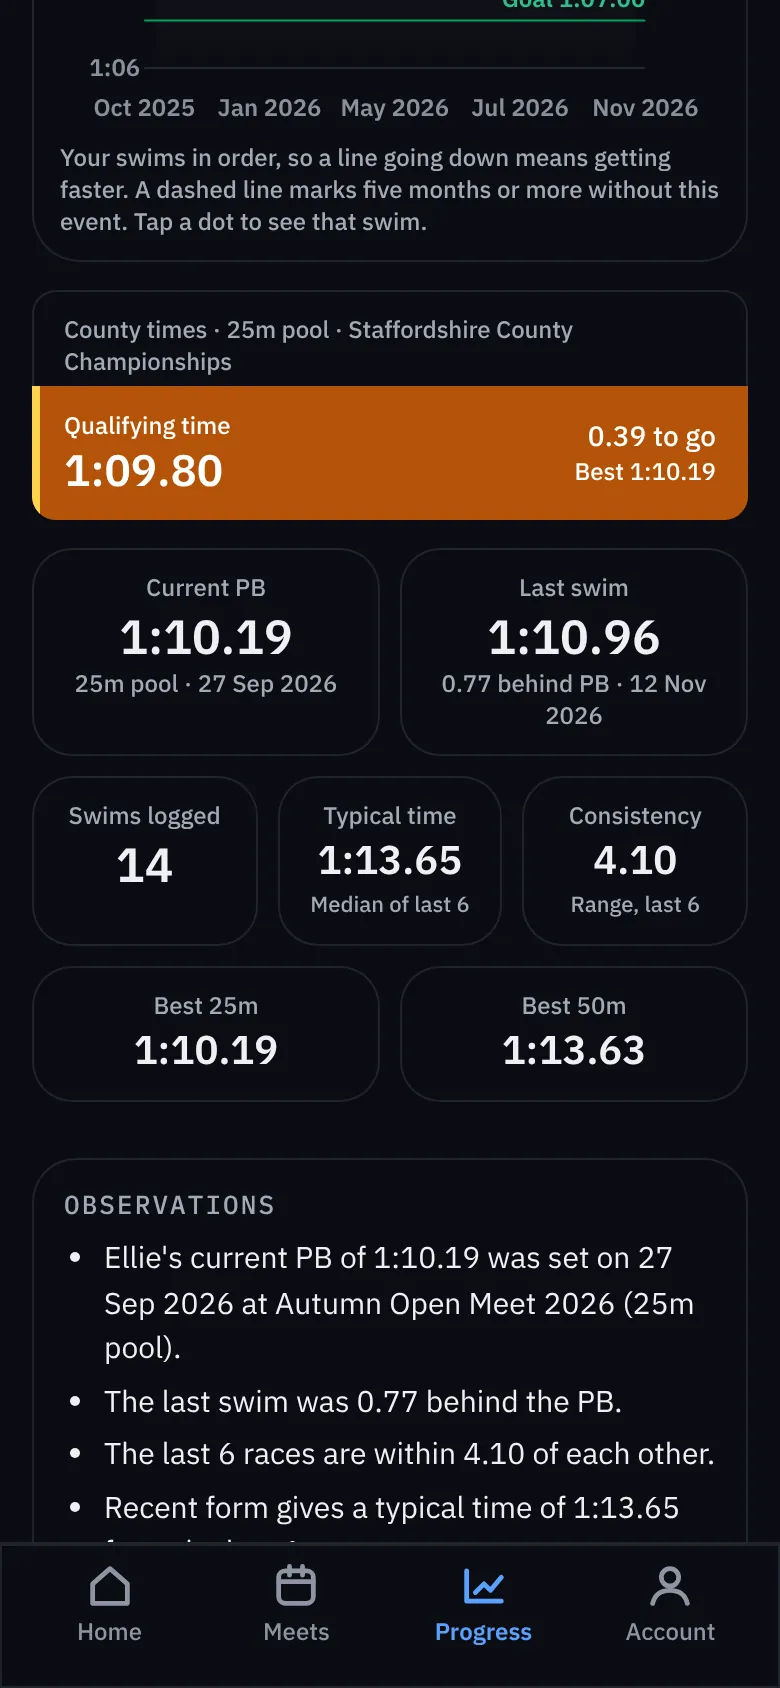
- Current PB and last swim (and how far behind the PB it was).
- Typical time: the middle time of the last 6 swims, a fair idea of current form.
- Consistency: the gap between the fastest and slowest of the last 6 swims. Smaller is steadier.
- Best time at each age, how each swim felt, and the average race review scores.
At the bottom is every swim of the event, newest first, each compared with the best time before it.